EDUCATION PREPARATION PROVIDER (EPP) DATA
2024 - 2025 Data
Measure 1 (Initial): Completer Effectiveness. (R4.1)
Teachers prepared by the Faulkner University’s Educator Preparation Program (EPP) consistently demonstrate a positive impact on P-12 student learning. This is evidenced through achievement data, evaluations, and satisfaction surveys. Completer effectiveness is assessed through triangulated data: case study evidence of impact, principal interviews, and the Alabama First- and Second-Year Teacher Survey (Sept. 2024).
Components of Case Studies:
1. Evidence of Impact on Student Learning
2. Completer Interviews
3. Principal Interviews (R4.1.3)
Evidence of Impact on Student Learning
Elementary Education
Since fall 2017, 57 candidates completed the Elementary Education program; after exclusions, 45 were eligible, and 6 participated. Participants taught in varied school contexts, including high-poverty, majority-minority schools.
Evidence of Impact on Student Learning
Completer A: Oral Reading Fluency: 14 of 17 students made gains (avg. gain: 12 pts).
Completer B: Star Reading: At/Above scores increased from 77% to 87%.
Completer C: Science standards mastery reported mid-year due to BOY test issues.
Completer D: iReady Reading: Grade-level readers increased; 2+ levels below dropped from 27% to 8%. iReady Math: Below-grade students dropped from 41% to 10%.
Completer E: Oral Reading Fluency: 72% of students showed growth (Aug–Sept).
Completer F: Math: 56% had gains; 25% stayed the same; 19% declined.
Completer G: Star Math: At/Above increased from 77% to 86%; Below dropped from 23% to 14%.
Completer H: One student’s fluency rate increased from 47 to 61 WCPM.
Data from Principal Interviews
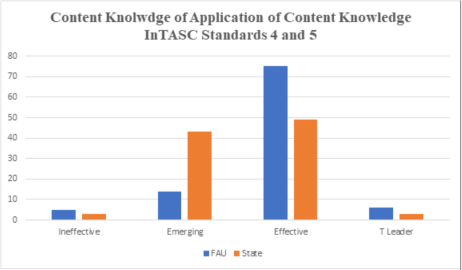
Responses from the questions for InTASC Standards 4 and 5 from the Principal Interviews were used to meet the second part of Standard 4.1, specifically, Apply in P-12 classrooms the professional knowledge, skills, and dispositions that the preparation experiences were designed to achieve.
Standards 4 and 5 are represented in Questions 8, 9, and Questions 20 to 24:
Based on your observation or knowledge, how effective is the first-year teacher when it comes to:
8. Demonstrating effective and accurate content knowledge?
9. Appling content knowledge accurately and effectively during classroom instruction?
20. Engaging in leadership, initiating and engaging in professional growth?
21. Collaborating with colleagues?
22. Practicing professional ethics?
23. Engaging with parents and his/her community?
24. Using technology effectively?
Completer A: On track; broad knowledge base; strong Science of Reading knowledge; leadership and collaboration; ethical; engages parents/community.
Completer B: Has content knowledge and connections; grade-level lead planner; professional with ideas; works well with all including parents.
Completer C: Collaborates with pod; plans based on student motivation; strong history/science content; uses hands-on and digital resources; ethical; pushes students.
Completer D: Committed to PD; reflective; positive and asset to school.
Completer E: On track; broad knowledge; strong Science of Reading; proactive parent engagement; ethical; uses technology effectively but moderately.
Completer F: Strong planning foundation; collaborative; engages parents; tech-savvy.
Completer G: Content knowledge; grade-level lead planner; professional; collaborates; uses technology including assessment tools.
Completer H: Self-directed content learning; collaborates; balanced technology use; kind with parents
Based on these principals’ responses, the EPPs completers contribute to P-12 student grown.
Physical Education
Data for Impact on Student Learning
Completer I 12 students all increased sit-up counts from average 5 to 18.
Completer J Curl Ups and Push Ups data showed majority at Healthy or High Fitness levels with improvements.
Data from Principal Interviews
Principal Feedback:
Completer I: Prepared, uses varied strategies, demonstrates leadership, ethical, community-engaged, uses technology in activities.
Completer J: Plans collaboratively, leader, strong parent relationships, uses smartboard tech effectively.
Alternative A
22 completers in 7 years; 18 eligible; 2 participated.
Completer K: Teaches grades 5-8; school in top 50% for test scores; diverse population.
Completer L: Teaches PK-6; 27% proficient in math, 49% proficient in reading; majority economically disadvantaged.
Data from Impact on Student Learning
Completer K: Star Reading increased At/Above from 58% to 63%.
Completer L: Language arts composite scores improved from BOY to EOY (Above and Benchmark increased).
Data from Principal Interviews
· Responses from the questions for InTASC Standards 4 and 5 from the Principal Interviews were used to meet the second part of Standard 4.1, specifically, Apply in P-12 classrooms the professional knowledge, skills, and dispositions that the preparation experiences were designed to achieve.
· Standards 4 and 5 are represented in Questions 8, 9, and Questions 20 to 24:
· Based on your observation or knowledge, how effective if the first-year teacher when it comes to:
8. Demonstrating effective and accurate content knowledge?
9. Appling content knowledge accurately and effectively during classroom instruction?
20. Engaging in leadership, initiating and engaging in professional growth?
21. Collaborating with colleagues?
22. Practicing professional ethics?
23. Engaging with parents and his/her community?
24. Using technology effectively?
Completer K: Cross-curricular; strong content knowledge; uses data for action plans; reflective practitioner.
Completer L: Effective planner; asks higher-order questions; serves as leader; improving math skills; strong parent engagement; uses technology appropriately.
Data from the State’s First- and Second-Year Teacher Survey
The Educator Prep Institutional Report Cards provide data on individuals who completed a Class B or Alternative Class A program at an Alabama institution and their professional certificate was issued in the reporting period. The 2024 report covers those who passed their assessment during the 2023-2024 academic year, along with surveys from teachers and employers between August 2023 and July 2024. (R4.1.1)
The data provided is for Faulkner completers, but the data is not disaggregated by pursuit.
The Alabama Association of Colleges for Teacher Education members developed the surveys which are administered electronically to first- and second-year teachers and employers. Survey prompts are aligned with InTASC standards. Reponses from principals clearly indicate that Faulkner graduates are making an impact on the students they teach. (R4.1.2) When ratings are analyzed, the EPP’s completers’ averages are higher than state averages for most of the items for either Teacher Leader or Effective. When scores for Teacher Leader and Effective are combined, the EPP’s scores are higher for almost every prompt. The EPP believes that employers of EPP completers see them as being impactful in their schools.
Conclusion
Data from three sources was triangulated in order to assess Standard R4.1. The three forms of data were 1) impact on student learning, 2) portions of principal interviews and 3) a state survey administered to first- and second-year completers. Data for impact on student learning was derived from: 8 elementary education completers, 2 Physical Education completers, and 2 Alternative A completers. The data supplied for the 12 completers all supports student learning.
Interviews were conducted with the principals of the 12 completers and all positively responded that the completers did contribute to student learning.
The third source was the state survey completed by employers of completers. While this data is not disaggregated, it does supply a snapshot of the quality of Faulkner University completers. The comparison of survey data specific for Faulkner completers to completers statewide found that the employers believed that our graduates have a deep knowledge of content and can effectively apply their knowledge in the classroom. Again, the data for the Effective and Teacher Learner levels exceeds that of the state average.
The convergence of findings from these sources of data, through triangulation, supports the conclusion that the completers of the Faulkner College of Education do contribute to P-12 student learning growth and apply in P-12 classroom the professional knowledge, skills, and dispositions that the preparation experiences were designed to achieve.
Measure 2 (Initial and Advanced): Satisfaction of employers and stakeholder involvement. (R4.2, R5.3, RA4.1)
R4.2 Satisfaction of Employers
To assess satisfaction of employers, two sources were triangulated. The first is from EPP case studies, particularly the Principal Interviews that directly assess satisfaction with specific completers. Twelve interviews were conducted: eight for elementary education completers, two for physical education, and two for Alternative.
The second source is the Employers’ responses to the First- and Second-Year Survey created by the Alabama Association of College of Teacher Education and administered by the Alabama State Department of Education.
Evidence of Employer Satisfaction
Elementary Education
Case study evidence from eight completers was used to assess employer satisfaction with their preparation.
Employer Satisfaction: Working with Diverse Students and Families
Responses from the questions for InTASC standards 2, 3, and 10 from the Principal interviews were used to assess this standard. Specific questions for these standards are: Based on your observation or knowledge, how effective is the teacher when it comes to:
- 3. Effectively differentiating instruction and meeting the needs of individual students? Working in inclusive classrooms? 5. Effectively teaching students from diverse backgrounds? 23. Engaging with parents and his/her community?
The following are responses from principals concerning:
Differentiation / Individual Needs
Adapts for all students, including ELL and special ed.; Differentiates well; meets individual needs; Uses data, diagnostics, and varied strategies; Supports individual needs; high expectations; Strong in differentiation; Relies on team plans; needs growth here; Knows students well; differentiates effectively; Plans based on student needs.
Inclusive / Diverse Classrooms
Adapts for ELL and special ed; Well-prepared for diverse students; Aware of opportunity gaps; engages all learners; Supports ELL and special needs; uses Spanish; Effective in diverse, inclusive settings; Adjusts well to diverse and low-income students; Strong in inclusive and diverse setting;Works well with diverse learners.
Responses Related to Family / Community Engagement
Proactive with parents; not just for issues; Works well with families; Respects and collaborates with parents; Involves and supports parents; Very proactive with families; Communicates well; keeps parents involved; Strong parent engagement.
Responses Related to Professionalism / Disposition
Clearly ethical; Nurturing, decisive, disciplined; Shows empathy and respect.
Physical Education
Principal Feedback:
Prepared, uses varied strategies, demonstrates leadership, ethical, community-engaged, uses technology in activities; Plans collaboratively, leader, strong parent relationships, uses smartboard tech effectively.
Alternative A
Differentiation / Individual Needs
Knows each student; uses small groups to differentiate; Differentiates well; strong in inclusive settings.
Inclusive / Diverse Classrooms
Effective with diverse learners; works well in inclusive classrooms.
Family / Community Engagement
Excellent with parents; builds rapport early; strong in conferences; Strong parent relationships; known in the community as a coach.
Professionalism / Disposition
Clearly respectful and empathetic.
Data from the State’s First- and Second-Year Teacher Survey
The data provided is for Faulkner completers, but the data is not disaggregated by pursuit.
The Alabama Association for College for Teacher Education members developed the surveys which are administered electronically to first- and second-year teachers and employers. Survey prompts are aligned with InTASC standard.
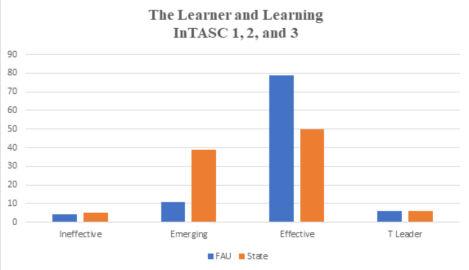
Survey results from the Alabama State Department of Education's First- and Second-Year Teacher Survey provide insight into principal perceptions of Faulkner University’s educator completers compared to those from other Alabama institutions. Specifically, responses from principals focused on two key InTASC standards: understanding learner differences and managing the learning environment.
For the standard related to understanding learners’ commonalities and individual differences, 47.5% of Faulkner completers were rated as “Effective” and 8.5% as “Teacher Leader,” totaling 68% in the top performance tiers. In comparison, 48.5% of all Alabama completers were rated as “Effective” and 9% as “Teacher Leader,” for a total of 70%. While Faulkner's combined top-tier ratings were slightly below the state average, they remain closely aligned with statewide performance.
In managing the learning environment to actively engage learners, 50% of Faulkner completers were rated as “Effective” and 9% as “Teacher Leader,” totaling 59% in the top categories. This compares to 51% and 10%, respectively, for all Alabama completers, totaling 61%. Again, Faulkner completers performed comparably to the statewide average, with a slight gap in the highest combined ratings.
Notably, Faulkner completers had a slightly higher percentage of respondents rated as “Emerging” in both areas—40.5% compared to the state’s 38.5% in understanding learner differences, and 36% compared to 35% in managing the learning environment. These results suggest that while Faulkner graduates perform similarly to their peers across the state, there is room for continued growth in moving more completers into the top performance categories.
Overall, the survey data indicates that principals perceive Faulkner University completers as competent and well-prepared, with performance levels closely aligned with those of other educator preparation programs in Alabama.
R5.3 and RA5.3 Stakeholder Involvement
The EPP relies on the collaboration of internal and external stakeholders to maintain a robust Quality Assurance System (QAS), regularly assess EPP performance and impact, and guide continuous program improvement.
Data and analysis of three annual measures of impact are posted publicly at https://www.faulkner.edu/academics/college-of-education/education-preparation-provider-epp-data/ . This website is updated annually in conjunction with CAEP reporting and is shared with stakeholders including candidates, faculty, and external partners.
EPP Administration and Leadership
The Dean of the College of Education (COE) oversees all educator preparation programs. Program-level leadership includes: The Director of Master’s Program (Traditional M.Ed. Elementary Education and Alternative A programs for Elementary, English Language Arts, and Social Science). The Secondary Department Chair is responsible for initial secondary programs in English Language Arts, Social Science, Choral Music, and Instrumental Music. The Elementary Education Chair is responsible for Elementary Education and Physical Education, and the Director of School Counseling is responsible for the Master’s in Counseling. This seven-member group serves as the policy-making body for all programs. Data and assessment results are regularly reviewed to guide policy and curricular decisions, including consultation with the Teacher Advisory Council (TAC).
Faculty and Staff
EPP faculty and staff are integral to the effectiveness of the Quality Assurance System (QAS). (Evidence: QAS Handbook) They engage in regular review of course content, candidate performance, and assessment data. Faculty complete candidate evaluations on key assessments and contribute to program decisions.
Faculty also serve on the Teacher Advisory Council which meets twice annually to review data, discuss outcomes, and propose improvement.
Stakeholders
Teacher Advisory Council
The TAC includes current and retired teachers, school administrators, community representatives, and employees of the State Department of Education. The TAC meets twice a year: in the fall to share data from the previous year, and in the spring, to review assessments, contribute feedback on field experiences, and assist with developing or revising assessments. The Fall meeting has been divided into two meetings, one for elementary education (initial and advanced) and one for physical education, and has been held via Zoom the last two fall semesters. TAC members also participate in small-group work sessions to evaluate content validity and reliability of assessments. Feedback from the TAC has resulted in measurable program improvements. For example, in the Spring of 2025, the TAC was asked about the current process of asking completers and their employers to take part in interviews and to complete surveys aimed at determining completers’ and employers’ satisfaction with the completers’ preparation. The items on both of these instruments are aligned with InTASC standards and virtually ask the same questions. The TAC recommended that the EPP maintain the interviews but not the survey in hopes that the number of participants will increase. Responses to both the interviews and the surveys contribute to the EPPs evaluation program, but often the information from the interviews is more relevant than that gleaned with a survey. Also, during this meeting, participants were asked for suggestions on how the EPP can strengthen collaboration with families and the community. Members made several suggestions as documented in the minutes.
Candidates
Candidates are key stakeholders in the EPP. They can access program performance via the EPP website and provide feedback through formal interviews professional learning communities.
Summary
The EPP uses multiple valid and consistent measures to continuously assess candidate performance and program effectiveness. Extensive stakeholder involvement, including faculty, candidates, advisory councils, and external partners, ensures that data analysis leads to meaningful continuous improvement. Through these collaborations, the EPP has implemented changes such as updating assessment assignments and rubrics to reflect contemporary classroom practices and verbiage, illustrate how stakeholder collaboration directly strengthens candidate preparation for today’s P-12 classrooms.
RA4.1 Satisfaction of Employers
Traditional Master’s Program
To assess employer satisfaction with candidate preparation, the EPP utilizes structured interviews with hiring principals. The resulting feedback directly informs the EPP’s ongoing program evaluation and improvement efforts.
Sampling and Representativeness
Three interviews were conducted with principals of Traditional Master’s completers. These completers are a sample of completers from the last six cohorts, N=18. While all completers were invited to participate in the study, only 3 volunteered, resulting in a limited sample size that nonetheless provides meaningful insight.
Instrument and Standards Alignment
The Teacher Employer Interview prompts are aligned with National Board Middle Childhood Generalist Standards, ensuring alignment with nationally recognized indicators of teaching effectiveness and professional growth.
Evidence of Employee Satisfaction
Principal Interview Data
Responses included:
Demeanor is calming and uses a calm voice; uses humor to make students comfortable; Our school is about 90% white, 5% African American, and 5% Hispanic. She treats all of her students the same and provides all of them what they need; She is a trainer for AMSTI science. Her content knowledge is very strong—in fact sometimes I have to speak to her to remind her to bring the content down a little; She finds great resources and activities and tries to use a lot of them when she should just go with a few; She uses research from her training; She analyzes data well. Recently we looked over test scores and she noticed some reading areas of need. She teaches SS and Science, but decided to incorporate some reading in her courses in an effort to help these areas; Her work with families is a work in progress because she came here from a large city where the parents were more affluent than those here. She holds her students to a high standard and it has been a learning curve to work in this rural area. Our population is 45% Free/Reduced; I have been in an IEP and Parent Conferences with her and she is very professional and has a good professional relationship with her peers and parents. Her ACAP scores from the last two years for science have been great. Last year her students scored 45% out of 683 schools for 4th grade and the year before it was even higher; She handles changes very well. She seems to go with the flow 85% of the time; She is eager to improve her craft. I am pretty pleased with her and am glad she is on my staff; She is a little above the normal for first year teachers. She is mature and organized; She is an outstanding teacher and a teacher leader; Classroom management is a strength of hers, and she engages her students in the class on a daily basis; She is a grade level chair, and she is also the second-grade rep for the county on the Curriculum Committee; Her ability to be an effective decision maker is evidenced with the academic growth of her class; She participates in the school/community activities and often is the lead organizer; She serves on various committees for the school and county; She is constantly participating in professional development and applies new learning/technology in her classroom; She has completed LETRS, and she is presently taking the Neuhaus course.
School Counseling Program
Although the School Counseling program has not had any completers in the past three data cycles, systems are in place to gather feedback once students begin completing the program. Both a Completer Satisfactions Survey and an Employer Satisfaction Survey have been developed and will be implemented as soon as current students graduate and enter the workforce. These tools will help ensure continuous improvement as current students progress through the program.
The two surveys are based on school counselor specific standards which represent the professional expectations of entry level counselors. Each of the surveys has 10 multiple choice items and one qualitative item. These evaluations will assist in monitoring program effectiveness and quality assurance.
Measure 3 (Initial and Advanced): Candidate competency at completion. (R3.3)
Measure 4 (Initial and Advanced): Ability of completers to be hired in positions for which they have prepared).
Initial Certification Tracking – Graduates in Fall 2024 and Spring 2025
The linked chart shows that 100% of our candidates who graduated in 2024-2025 are working in the field full-time in the area in which they prepared.
2023-2024 Data (archived)
Measure 1
Faulkner University College of Education
Initial Preparation
Elementary Education
R4.1
Standard R4.1 of the CAEP accreditation process requires that Education Preparation Providers (EPPs) supply evidence of completers contribution to P-12 student learning growth and apply in P-12 classrooms the professional knowledge, skills, and dispositions that the preparation experiences were designed to achieve.
Components Used to Address R4.1
Data from three sources will be triangulated. The first and second sources are parts of Case Studies completed by the EPP. These case studies involve several assessments but component 1, evidence of impact, and component 3, principal interviews, will be used to meet Standard R4.1
Components of Case Studies:
Evidence of Impact on Student Learning
Graduate Interviews
Principal Interviews
Evaluations completed by a Principal or designee
The third source of data are responses to the First- and Second-Year Teacher Survey created by the Alabama Association of Colleges of Teacher Education, administered by the Alabama State Department of Education in September 2023.
Evidence of Impact on Student Learning
Evidence of impact on student learning supplied by two completers as part of case studies was used to determine if the completers effectively contributed to P-12 student-learning growth.
The spring 2022 undergraduate elementary program graduated 5 teachers. All 5 had accepted employment in the field for the 2022-2023 academic school year. Out of this pool of 5, 2 (4%) responded to the invitation to participate in the study. There were no Physical Education graduates.
The spring 2022 Alt A program graduated 3 teachers. All 3 had either accepted jobs or were already employed in the classroom. Out of this pool of 3, 1 (33%) responded to the invitation to participate in the study. This completer’s data is combined in the following information.
The participants were contacted by email and given a description of the expectations for the study along with a link to a video that also explained the expectations.
All three completers are white females.
Introduction and Background of Participants
Completer A (Elementary Education) teaches in a public school that serves 713 students PK-6. Test scores at this school are above the state average. The school population is composed of 69% white, 8% black, and 18% Hispanic students, with 59% considered low-income. Students are 56% male and 44% female.
Completer B (Elementary Education) teaches in the public school that serves 864 students, K-8. Test scores at this school are above the state average. The school population is composed of 83% white, 7% Hispanic, and 5% black, with 59% considered to be low-income. Students are 47% male and 53% female.
Completer C (Alternative A) teaches in a public school that serves 1,016 students in grades 5-8. This school ranks in the top 50% of all schools in Alabama for overall test scores (math proficiency is top 50% and reading proficiency is top 50%). The school population is 58% white, 33% black, and 4% Hispanic. Students are 55% male and 45% female.
Data for Impact on Student Learning
Completer A provided two months of progress monitoring data (August and September) for aimsweb Plus Oral Reading Fluency.
In a class of 18 first grade students, one student was absent for the second testing, 3 students did not make gains, and 14 students made gains.
The average gain was 12 points and the range was 1 to 22.
The average loss was 10 points and the range was 4 to 18.
Completer B provided Star language arts data for two data points for 22 second grade students: August 21, 2023 to September 7, 2023 and October 16, 2023 to October 28. 2023.
For Aug/Sept, 36% tested at Level 5 (At/Above), 23% tested at Level 4 (At/Above), 18% tested at Level 3 (At/Above), 9% tested at Level 2 (Below) and 14% tested at Level 1 (Below). Combined, 77% test At/Above and 23% tested Below level.
For the October testing: 41% tested at Level 5 (At/Above), 23% tested at Level 4 (At/Above, 23% tested at Level 3 (At/Above), 5% tested at Level 2 (Below) and 9% tested at Level 1 (Below). Combined, 87% tested at/above and 14% tested below level.
When the two test dates are compared, the At/Above group increased by 10% and the Below group decreased 9%.
Completer C provided Star Reading (English) scores for two data points, Aug/Sept and Dec/Jan.
For Aug/Sept, 17% tested at Level 5 (At/Above), 25% tested at Level 4 (At/Above), 17% tested at Level 3 (At/Above), 21% tested at Level 2 (Below), and 21% tested at Level 1 (Below). Combined, 58% tested At/Above and 42% tested Below level.
For the October testing: 25% tested at Level 5 (At/Above), 21% tested at Level 4 (At/Above), 17% tested at Level 3 (At/Above), 21$ tested at Level 2 (Below), and 17% tested at Level 1 (Below). Combine, 63% tested At/Above and 37% tested Below.
When the two test dates are compared, the At/Above group increased by 5% and the Below decreased by 5%.
Data from Principal Interviews
Responses from the questions for InTASC Standards 4 and 5 from the Principal Interviews were used to meet the second part of Standard 4.1, specifically, Apply in P-12 classrooms the professional knowledge, skills, and dispositions that the preparation experiences were designed to achieve.
Standards 4 and 5 are represented in Questions 8, 9, and 20-24:
Based on your observation or knowledge, how effective if the first-year teacher when it comes to:
8. Demonstrating effective and accurate content knowledge?
9. Appling content knowledge accurately and effectively during classroom instruction?
20. Engaging in leadership, initiating and engaging in professional growth?
21. Collaborating with colleagues?
22. Practicing professional ethics?
23. Engaging with parents and his/her community?
24. Using technology effectively?
Completer A
She is absolutely on track as a first-year teacher. She came to use with a broad knowledge base.
She is very knowledgeable of the Science of Reading. Few other first year teachers have this strong of knowledge about it.
Yes, she engaged in leadership, initiating and engaging in professional growth
Yes, she collaborates with others.
She practices professional ethics
She engages with parents and community members
Completer B
She definitely has the content knowledge and she understands the connections.
She is a grade level lead planner.
She is a professional and has ideas and knows what to do next.
She works effectively with everyone, including parents.
Completer C
She teaches English Language Arts and Social Studies so he has lots of ways to do cross-curricular activities.
She has always known her content!
She knows her 5th graders and gives them the lessons they need.
She is aware of how each one learns and she uses a lot of small groups so that she can differentiate instruction.
When we meet to discuss checkpoints on assessments like the STAR test, she comes with an action plan for her students based on data.
After observations she talks of reflecting on teaching and then making changes.
Based on the responses from the three principals, the EPP has determined that completers of the Faulkner College of Education do contribute to P-12 student learning growth.
Link to Principal Interview, Initial Preparation
https://docs.google.com/document/d/1NjD8gifnASxlanumhD_lJ-YVcdH5K2VG/edit
Data from the State’s First- and Second-Year Teacher Survey
The Educator Prep Institutional Report Cards provide data on individuals who completed a Class B or Alternative Class A program at an Alabama institution and their professional certificate was issued in the reporting period. The 2023 report covers those who passed their assessment between August 1, 2021 and July 31, 2022 along with surveys from teachers and employers between August 2022 and July 2023. The data provided is for Faulkner completers, but the data is not disaggregated for the different pursuits.
The Alabama Association of Colleges for Teacher Education members developed the surveys which are administered electronically to first- and second-year teachers and employers. Survey prompts are aligned with InTASC standards. Responses from Principals for prompts aligned with Standards 4 and 5 are represented in the following chart.
When the Faulkner graduates were compared to graduates from other Alabama EPPs, the hiring principals agreed that our graduates have a deep knowledge of content and can effectively apply their knowledge in the classroom.
Data suggests that the percentage of the EPP’s graduates considered to be Teacher Leaders exceeds that for the state average.
Link to State Report for 2023 https://drive.google.com/drive/folders/1xKCPTwR5_MQErwYYDxTEXg3_nPtz2xqq
Link to the summary of findings from the State Report for 2023
https://docs.google.com/document/d/11cg8Gj_st6BFim80HUSYDMJp8uSDyMuZ/edit
Conclusion
Data from three sources was triangulated in order to assess Standard R4.1, the Education Preparation Providers (EPPs) supply evidence of completers contribution to P-12 student learning growth and application in P-12 classrooms the professional knowledge, skills, and dispositions that the preparation experiences were designed to achieve.
The three forms of data were 1) impact on student learning, 2) portions of principal interviews and 3) a state survey administered to first- and second-year completers. Data for impact on student learning was derived from two elementary education completers and one Alternative A completer. There were no Physical Education completers who either graduated 6 months to a year earlier, or who are teaching in field. The data supplied for the 3 completers all supports student learning.
Principal interviews were conducted with the three completers and all three positively responded that the completers did contribute to student learning.
The third source was the state survey completed by employers of completers. While this data is not disaggregated, it does reflect the entirety of completers. The comparison of survey data specific for Faulkner completers to completers state wide found that the employers believed that our graduates have a deep knowledge of content and can effectively apply their knowledge in the classroom. Again, the data for the Effective and Teacher Learner levels exceeds that of the state average.
The convergence of findings from these sources of data, through triangulation, supports the conclusion that the completers of the Faulkner College of Education do contribute to P-12 student learning growth and apply in P-12 classroom the professional knowledge, skills, and dispositions that the preparation experiences were designed to achieve.
Measure 2
Measure 2:
Initial and Advanced
Satisfaction of Employers and Stakeholder Involvement
Satisfaction of Employers: Initial
To assess satisfaction of employers, data from two sources was triangulated. The first source is one part of the Case Studies completed by the EPP. These case studies involve several assessments but the Principal Interviews directly assesses the satisfaction of principals with specific completers.
Two principal interviews were conducted with principals of two completers from the Elementary Education program and one completer from the Alternative A program. All three are white females. These volunteers are from a group of 5 elementary completers and three Alternative A completers, representing 4% and 33% respectfully. There were no Physical Education completers.
The second source is data from Principals’ responses to the First- and Second-Year Teacher Survey created by the Alabama Association of Colleges of Teacher Education and administered by the Alabama State Department of Education in September 2023.
Introduction and Background of Participants
Completer A (Elementary Education) teaches in a public school that serves 713 students PK-6. This school’s test scores are above the state average. The school population is composed of 69% white, 8% black, and 18% Hispanic students, with 59% considered low-income. Students are 56% male and 44% female.
Completer B (Elementary Education) teaches in a public school that serves 864 students, K-8. This school’s test scores are above the state average. The school population is composed of 83% white, 7% Hispanic, and 5% black, with 59% considered to be low-income. Students are 47% male and 53% female.
Completer C (Alternative A) teaches in a public school that serves 1,016 students in grades 5-8. This school ranks in the top 50% of all schools in Alabama for overall test scores (math proficiency in top 50% and reading proficiency in top 50%). The school population is 58% white, 33% black, and 4% Hispanic. Students are 55% male and 45% female.
Data to Support Employer Satisfaction with Preparation in Working with Diverse Students and Families
Principal Interviews
Responses from the questions for InTASC standards 2, 3, and 10 from the Principal Interviews were used to assess this standard. Specific questions for these standards are:
Based on your observation or knowledge, how effective if the first-year teacher when it comes to:
- 3. Effectivelydifferentiating instruction and meeting the needs of individual students?
- Working ininclusive classrooms?
- Effectivelyteachingstudents from diverse backgrounds?
- Engaging with parents and his/her community?
Completer A
- She is very effective. She has special ed and ELL students in her class. She adjusts her instruction to meet the needs of all her students.
- Yes, she absolutely practices professional ethics.
- She does very well with parents. She reaches out with both praise and not just when there are problems. She is very proactive.
Completer B
- Yes, she effectively differentiates instruction and meets the needs of her individual students.
- She just knows what to do for each student, and she does it.
- She is more than prepared to effectively teach students from diverse backgrounds.
- She works effectively with everyone, including parents.
Completer C
- She knows her 5th graders and gives them the lessons they need. She is aware of how each one learns and she uses a lot of small groups so that she can differentiate instruction.
- She is excellent with parents. At the beginning of school, we call all students in the homerooms. I sat in on one parent conference with her and a students’ great-grandmother. It was a good meeting and Mrs. Xxxx has a great rapport with the grandmother.
Link to Principal Interview, Initial Preparation
https://docs.google.com/document/d/1NjD8gifnASxlanumhD_lJ-YVcdH5K2VG/edit
Data from the State’s First- and Second-Year Teacher Survey
The Educator Prep Institutional Report Cards provide data on individuals who completed a Class B or Alternative Class A program at an Alabama institution and their professional certificate was issued in the reporting period. The 2023 report covers those who passed their assessment between August 1, 2021 and July 31, 2022 along with surveys from teachers and employers between August 2022 and July 2023. The data provided is for Faulkner completers, but the data is not disaggregated for the different pursuits.
The Alabama Association of Colleges for Teacher Education members developed the surveys which are administered electronically to first- and second-year teachers and employers. Survey prompts are aligned with InTASC standards. Responses from Principals for prompts aligned with Standards 2 and 3 are represented in the following chart. Responses for Standard 10 are in the second chart.
When the Faulkner graduates were compared to graduates from other Alabama EPPs, the hiring principals agreed that our graduates are more effective in understanding how learners grow and develop, more effective in understanding learners’ commonalities and individual differences, and better understand how to manage the learning environment to engage learners actively.
Data suggests that the percentage of the EPP’s graduates considered to be Teacher Leaders is equal to that for the state average.
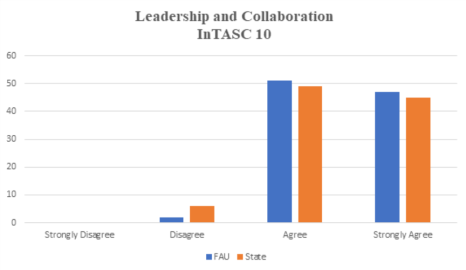
When the Faulkner graduates were compared to graduates from other Alabama EPPs, the hiring principals agreed that our graduates are more effective in collaborating with learners, families, colleagues, and other school professions and community members and that they more often seek appropriate leadership roles.
Data suggests that the percentage of the EPP’s graduates considered to be Teacher Leaders is greater than the state average.
Link to State Report for 2023 https://drive.google.com/drive/folders/1xKCPTwR5_MQErwYYDxTEXg3_nPtz2xqq
Link to the summary of findings from the State Report for 2023
https://docs.google.com/document/d/11cg8Gj_st6BFim80HUSYDMJp8uSDyMuZ/edit
Conclusion, Initial
Data from two sources was triangulated in order to assess Standard R4.2, The provider demonstrates employers are satisfied with the completer’s preparation for their assigned responsibilities in working with diverse P-12 students and their families.
The two forms of data were principal interviews and a state survey administered to employers of first- and second-year completers. Data was derived from two elementary education completers and one Alternative A completer. There were no Physical Education completers who either graduated 6 months to a year earlier, or who were teaching in field.
Principal interviews were conducted with the three completers and all three positively responded that their preparation was satisfactory.
The second source was the state survey completed by employers of completers. While this data is not disaggregated, it does reflect the entirety of completers. The comparison of survey data specific for Faulkner completers to completers state wide found that the employers believed that the EPP’s completers were effective in understanding the commonalities and differences of students and effective in collaborating with learners, families, colleagues, and other school professions and community members. When the number of Faulkner completers rated effective and teacher leader were compared to the total number of completers included in the survey, Faulkner completers equaled or exceeded numbers for completers from other institutions.
Based on the convergence of findings from these two sources of data, through triangulation, supports the conclusion that the employers of completers of the Faulkner College of Education are satisfied with the completers’ preparation for their assigned responsibilities in working with diverse P-12 students and their families.
Satisfaction of Employers, Advanced
There were five completers during 2022-2023. One completer (20%) volunteered and one participated. This completer is a teacher at a small urban public school, Pre-K through 6th grade. The completer teaches science and social studies. The school serves 568 students and has a minority enrollment of 12%. The student-teacher ratio is 18:1. The student population is made up of 52% females and 48% males. The school enrolls 33% economically disadvantages students. The school has been selected as a CLAS Alabama School of Distinction.
Data from two sources was triangulated. The first source is one part of the Case Studies completed by the EPP. These case studies involve several assessments but the Principal Interviews directly assesses the satisfaction of principals with specific completers.
The second source of data came from an Advanced Employer survey.
Principal Interview
The Principal Interview includes 9 prompts aligned with the National Board Middle Childhood Standards. Link to interview questions:
https://docs.google.com/document/d/1QiTkYrQXl5TdJpNJm4jnUD1Fme1Ynudr/edit
Based on your observation or knowledge, how effective if the first-year teacher when it comes to:
The following responses are grouped by topic:
Strengths Noted:
- Calm demeanor
- Treats all students equally
- Strong science content knowledge
- Analyzes data and uses that information for future planning
- Very professional
- Have a good professional relationship with peers and parents
- Handles change well
- Eager to improve her craft
Areas for Improvement Noted:
- Sometimes her expectations for students’ science knowledge is set too high
- Adjusting to parents in a rural area after coming from an urban area
And, when asked for any additional comments, the principal stated that the teacher is a little above normal for a beginning teacher. She is mature and organized.
Advanced Employers Survey
The third source is data from the Advanced Employer Survey. This EPP designed survey includes prompts that reflect the National Board Middle Childhood Specialists standards. The survey includes multiple prompts per standards.
Principals are given a QR code to complete the Google survey. The results for this completer by National Board Standards are as follows:
Standard I: Knowledge of Students: 2/2 Strongly Agree
Standard II: Respect for Diversity: 2/3 Strongly Agree, 1/3 Agree
Standard III: Establishing an Environment for Learning: 1/2 Strongly Agree, 1/2 Agree
Standard IV: Knowledge of Content and Curriculum: 3/3 Strongly Agree
Standard V: Instructional Decision Making: 5/6 Strongly Agree, 1/6 Agree
Standard VI: Partnership and Outreach: 2/2 Agree
Standard VII: Professionalism, Leadership, and Advocacy: 1/3 Strongly Agree, 2/3 Agree
Standard VIII: Responsiveness to Change: 1/1 Agree
16 of 27 responses, or 59%, were Strongly Agree, and 11 of 27 responses, or 41% were Agree. When asked to respond to prompt concerning suggestions for improvements for the Faulkner College of Education advanced preparation program, there was no response.
When asked to respond concerning strengths of the program, there was no response.
Link to the Google survey responses: https://docs.google.com/forms/d/1F_dJRMvPgRaaLLyJ2taeTfuzb6RXzp6eg5WRN8zxRLQ/edit#responses
Note: There were multiple responders, but there was only one completer who had all elements completed.
Conclusion, Advanced
The two forms of data were principal interviews and an employers survey.
A principal interview was conducted with one of five completers. The principal positively responded that preparation was satisfactory.
A principal survey was the second form of data. Again, the principal positively responded that preparation was satisfactory.
Based on the convergence of findings from these two sources of data, through triangulation, supports the conclusion that the employers of completers of the Faulkner College of Education are satisfied with the completers’ preparation for their assigned responsibilities in working with diverse P-12 students and their families.
Stakeholder Involvement
Faulkner COE Teacher Advisory Council (TAC)
The Teacher Advisory Council for the College of Education at Faulkner University includes a variety of individuals who hold a variety of roles within the University, Partner Schools, Partner School Systems, and outside education agencies. Many are professors, program completers, classroom teachers, principals, Central Office Staff, Heads of Schools, and past/retired school officials.
The council is devised to allow outside stakeholders to join the COE in making programs more effective. The council meets twice a year to review data and look at program improvements.
Link to Council/Committee Members
https://docs.google.com/spreadsheets/d/1OOi4l-b6-U163dhYC3f1RC7ie8TVuvKo/edit#gid=2135321271
April 26, 2022
Minutes, https://docs.google.com/document/d/1WYmhUyaJJT7Vhc4IhCjFcwX13iztUJoV/edit
May 8, 2023
Minutes, https://docs.google.com/document/d/14WUw2_PZhrnobeDjJqg9qM5JUlKUCOxy/edit
The minutes include information about what assessments were reviewed and evaluated along with recommendations by the committee members.
Attendees:
Dr. Nicki McLeod Faulkner Professor
Dr. Brian Lentz Faulkner, Former Community College
Dr. Elizabeth Davis Faulkner, Former ALSDE
Dr. Carol Tarpley Faulkner
Rebecca Horn Faulkner
Dr. Christi Jones Faulkner
Taryn Brodie Second Grade Teacher
Brittney Fureigh State Department, 3-5 Science Specialist
Bryant Marlow Principal
Brittney Kelly School Counselor
Lisa Boyd School Counselor
Michelle Williamson School Counselor
Hilary Rasmussen Completer, Teacher Reeltown Elementary
Laura Childs Completer, ARI Literacy Specialist
Mark McGee Alabama Department of Education
Bonnie Short Director, Alabama Reading Initiative
Agenda:
https://docs.google.com/document/d/1mk3GPI_rXzkyD96on3fngN786t3A1p8465U6lXmH2qM/edit
MOUs/Partnerships
The College of Education at Faulkner University is proud to have a variety of partnerships with school systems and individual schools in which our teacher candidates have an opportunity to work side by side with certified teachers to enrich their experiences in the classroom. The COE utilizes these schools for a variety of field experiences as well as internships. Through our partnerships, the COE strives to ensure our candidates are seeing a wide variety of teaching strategies, good classroom management, and professionalism.
The Faulkner University College of Education maintains MOUs with the following Schools and School Districts:
- Autauga County
- Cullman City
- Elmore County
- Lead Academy
- Chilton County
- Dale County
- Macon East
- Shelby County
- Alabama Christian Academy
- Prattville Christian Academy
- Churchill Academy
- Flowers Elementary
- Crump Elementary
- Pike Road Elementary
- Vaughn Road Elementary
- Blount Elementary
- Wilson Elementary
- Pike County
- Mobile Christian Elementary
- Bear Exploration Center
- Halcyon Elementary
Link to signed agreements: https://drive.google.com/drive/folders/15XBCLnaWnbDWHRWnkRKFGFpST1WFilNc
Measure 3: Candidate Competency at Completion
Measure 3: Candidate Competency at Completion
Initial and Advanced
The ability of completers to meet licensing requirements, including certification and any additional state-specific mandates, is crucial for the candidates’ career prospects in education.
Initial
For Measure 3, data from the following sources was triangulated.
- Meeting the EPPs Requirements: Initial and Advanced
- Internship Averages: Initial
- Elementary Praxis/Foundations of Reading Scores: Initial
Meeting the EPPs Requirements
The College of Education’s Handbook outlines the following requirements for completion of degrees:
Undergraduate Class B Elementary Education and Physical Education Candidates
To remain in the Teacher Education Program, a candidate must continuously meet the following requirements:
- Maintaina minimum of 2.75 grade point average overall, in professional studies and in the teaching field.
- Demonstrateprofessional dispositions during all coursework and clinical experiences.
- Submitall coursework demonstrating successful completion of ACTS and SPA standards mastery.
- Completion of all program gateways according to the mandatedtimeframes.
- Completion with passing scores of all state-required assessments (Praxis Exams, Foundations of Reading 190, andedTPA.
Any grade below a "C" in Professional Studies courses will not be used to meet certification requirements. ALSDE (Alabama State Department of Education) policies and university policies must be followed in the calculation of GPA and awarding of credit for courses taken and courses repeated. ALSDE policies will supersede university policies.
Alternative Master’s (ALT-A) Candidates
- All candidates entering the ALT-A in Elementary Education must meet the 4x12 in English Language Arts (4 English courses granting 12 hours of credit).
2.. To remain in the program, each candidate must maintain a 3.25 GPA in all areas.
- At theappropriate time, all candidates take the Praxis Exam(s) required by the state forlicensure and Elementary Education candidates also take the Foundations of Reading Assessment. All Praxis exams and the Foundations of Reading must meet the minimum score before moving on to the internship. During the last semester of all initial certification programs, candidates must do a full-semester internship and maintain average and above ratings from mentor teachers and university supervisors.
Internship Averages
Below are the internship averages as determined by the mentor teacher and university supervisors. Candidates are assessed with the Teacher Candidate Assessment 8 times throughout the internship semester, with the mentor teacher and university supervisor each doing 4 formal observations. The rankings are:
Rating Scale:
- Ineffective
- Developing
- Effective
- Distinguished
- Exemplary
Internship Unit Averages Fall 2022
Undergrads
|
Candidate |
PL. 1 |
PL. 2 |
Final Avg. |
|
|
|
|
|
|
Elementary Education |
|
|
|
|
Candidate 1 WF |
4 |
4.72 |
4.36 |
|
Candidate 2 WF |
4.3 |
3.9 |
4.1 |
|
Candidate 3 WF |
3.78 |
4.0 |
3.97 |
|
|
|
|
|
|
Final Cohort Avg. |
4.02 |
4.24 |
4.13 |
|
Physical Education |
PL.1 |
PL.2 |
Final Avg. |
|
|
|
|
|
|
Candidate 1 WF |
4.45 |
4.5 |
4.47 |
|
Candidate 2 BM |
4.71 |
4.4 |
4.5 |
|
Candidate 3 WM |
4.91 |
4.46 |
4.68 |
|
|
|
|
|
|
Final Cohort Avg. |
4.69 |
4.45 |
4.55 |
Internship Unit Averages Spring 2023
Undergrads
|
Student |
Pl. 1 |
Pl. 2 |
Final Avg. |
|
Elementary |
|
|
|
|
Candidate 1 WF |
3.34 |
4.16 |
3.75 |
|
Candidate 2 WF |
3.86 |
4.37 |
4.1 |
|
Candidate 4 BF |
3.7 |
4.12 |
3.91 |
|
Candidate 5 WF |
5 |
4.97 |
4.9 |
|
Candidate 6 WF |
4.28 |
4.72 |
4.5 |
|
Candidate 7 WF |
4.36 |
4.97 |
4.66 |
|
Candidate 8 WF |
4.54 |
4 |
4.25 |
|
|
|
|
|
|
|
|
|
|
|
Candidate 9 WF |
4.01 |
4.25 |
4.13 |
|
Candidate 10 WF |
4.94 |
4.85 |
4.9 |
|
Candidate 11 WF |
4.18 |
3.85 |
4.01 |
|
|
|
|
|
|
Final Cohort Average: |
4.26 |
4.43 |
4.34 |
|
|
|
|
|
|
Physical Education |
|
|
|
|
Candidate 1 BM |
4.5 |
4.51 |
4.5 |
|
Candidate 2 WM |
4.39 |
4.59 |
4.49 |
|
|
|
|
|
|
Final Cohort Avg. |
4.45 |
4.55 |
4.49 |
Praxis Scores
Fall 2022-Spring 2023 Elementary Praxis/Foundations of Reading Scores
Undergraduate Candidates INTERNSHIP COHORT
Praxis Exams are a series of American teacher certification exams written and administered by the Educational Testing Service. Various Praxis tests are usually required during educator preparation programs to measure candidate abilities.
The Foundations of Reading test (test code 190) for Alabama assesses proficiency in and depth of understanding of the subject of reading and writing development. The test reflects scientifically based reading research.
The data below consists of candidates’ scores before Internship entry. During this academic year, the following candidates met the national testing requirements to enter their Internship semester.
Below are the passing score in parentheses under each named assessment. For a short time, the State Department of Education allowed students to pass with a -1 Standard Error of Measurement (SEM) due to the national teacher shortage and the need to get teachers into classrooms. Scores with an * were a little under the previously required score. This is no longer in effect and the passing scores are back to the scores indicated in the parentheses under each category. As you can see, Faulkner University College of Education candidates surpassed the passing score in every subject area even though a few candidates qualified under the temporary -1 Standard Error of Measurement score.
|
Candidate |
Foundations of Reading Score (233) |
Tchg. Rdg #5205 (159) |
Math # 5903 (157) |
Social Studies #5904 (154) |
Science #5905 (158) |
|
Candidate 1 WF |
X |
164 |
184 |
154 |
159 |
|
Candidate 2 WF |
X |
159 |
160 |
151 |
159 |
|
Candidate 3 WF |
X |
163 |
190 |
161 |
180 |
|
Candidate 4 WF |
249 |
X |
161 |
172 |
163 |
|
Candidate 5 WF |
241 |
X |
151** |
168 |
158 |
|
Candidate 6 BF |
241 |
X |
157 |
155 |
172 |
|
Candidate 7 WF |
239 |
X |
187 |
160 |
158 |
|
Candidate 8 WF |
X |
160 |
160 |
148** |
159 |
|
Candidate 9 WF |
X |
166 |
167 |
147** |
175 |
|
Candidate 10 WF |
X |
166 |
159 |
159 |
170 |
|
Candidate 11 WF |
X |
169 |
175 |
165 |
178 |
|
Candidate 12 WF |
X |
167 |
179 |
162 |
158 |
|
|
|
|
|
|
|
|
Avg. WF:
|
243 |
164.2 |
170.2 |
158.8 |
165.18 |
|
Avg. BF:
|
241 |
N/A |
157 |
155 |
172 |
|
Total Avg.: |
242.5 |
164.2 |
169.1 |
158.5 |
165.75 |
**Took the -1 SEM
Fall 2022 Spring 2023- INTERNSHIP COHORT
Alt. A Candidates – Praxis Scores for Math, Social Studies, and Science were met before Teacher Education Program (TEP) entry.
Reading Praxis/Foundations of Reading were met prior to their internship.
|
Candidate |
FOR Score (233) |
Tchg. Rdg #5205 (159) |
Math # 5903 (157) |
Social Studies #5904 (154) |
Science #5905 (158) |
|
Candidate 1 WF |
261 |
X |
164 |
166 |
172 |
|
Candidate 2 WF |
275 |
X |
190 |
171 |
169 |
|
Candidate 3 WF |
263 |
X |
160 |
184 |
171 |
|
AVG: WF |
266 |
N/A |
171 |
173 |
170.6 |
Fall 2022-Spring 2023 Physical Education Praxis required prior to internship semester
|
Candidate |
Physical Education Praxis #5091 (149) |
|
|
Candidate 1 WF |
151 |
|
|
Candidate 2 BM |
151 |
|
|
Candidate 3 WM |
164 |
|
|
Candidate 4: WM |
151 |
|
|
Candidate 5: BM |
148** |
|
|
Avg: BM |
149.5 |
|
|
Avg. WM |
157.5 |
|
|
Avg. WF |
151 |
|
|
Total Avg. |
153 |
|
** Took the -1 SEM
Advanced
Class A Traditional Master’s
The EPP considers candiates to be competent at completion of their program when they have met the following requirements as set forth in the Graduate Handbook:
- Candidacy and admission into the Teacher Education Program.
- Completion of all courses and requirements listed on the appropriate degree plan, including 30 semester hours of graduate credit not used for any prior-level certification or degree in any teaching field or area of instructional support.
- Completion of a minimum total hours of clinical experiences.
- Completion of all institutional requirements for graduation, i.e., filing of appropriate forms with the Registrar’s Office, exit interview with the Financial Aid Office, and clearance with the Business Office.
- Minimum GPA of 3.25
- Successful completion of the master level special education course—if a special education course was completed prior to unconditional admission to the Traditional Class A Elementary program, students must take FED 6345, Multicultural Education. A course used to meet the requirement for one level of certification may not be used to meet the requirement for a higher level of certification.
- Satisfactory ratings on disposition forms from professors for each education course taken.
- Successful completion of the Capstone Portfolio
- A valid Class B Professional Educator Certificate in the same teaching field in which the Class A Professional Educator Certificate is sought.
Measure 4
Measure 4: Initial and Advanced: Ability of Completers to be hired in positions for which they have prepared.
Undergraduate Tracking – Graduates in Fall 2022 and Spring 2023
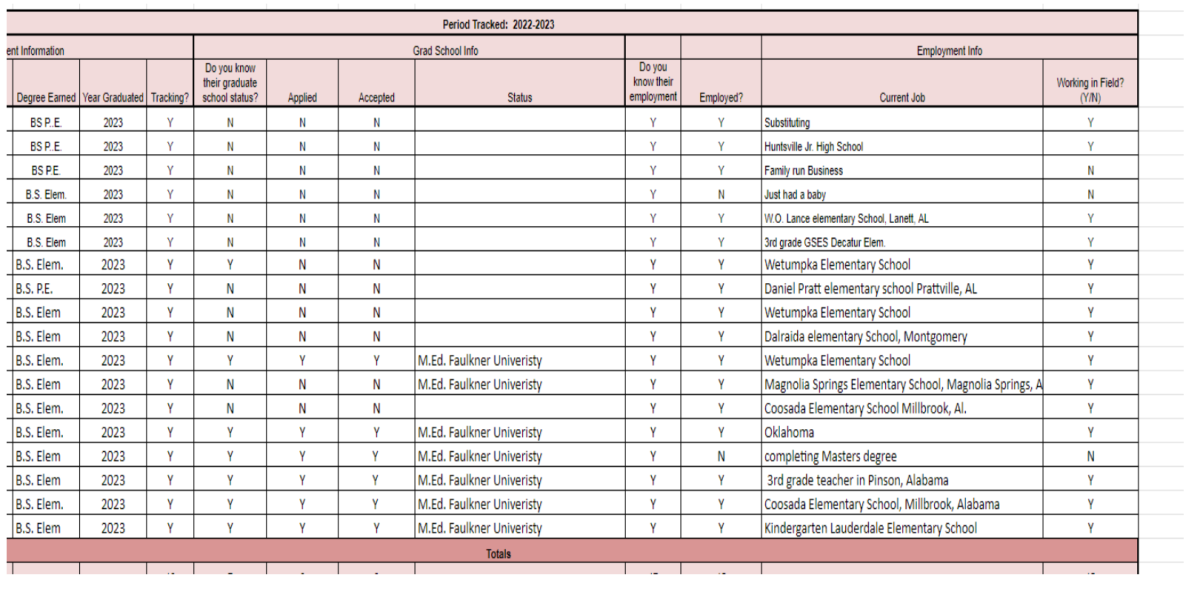
The above chart shows that 83.3% of our candidates who graduated in 2022-2023 are working in the field full-time in the area in which they prepared (14 Elementary Education and 4 Physical Education). Out of 18 graduates who received Class B Certification from the state of Alabama, 15 work full-time in an accredited Elementary or Jr. High School. One candidate (Physical Education) has a family-run business but recently decided to begin interviewing for a Physical Education position. One candidate (Elementary Education) focused on completing her master’s degree before seeking employment, while another candidate (Elementary Education) had a newborn and chose to stay at home with the new baby. She will graduate in June 2024 with her M.ED. One candidate (Physical Education) enjoys substituting in various county and city systems to determine where she wants to pursue full-time employment.
Graduate Tracking of Alt-A M.Ed Candidates in Fall 2022 and Spring 2023
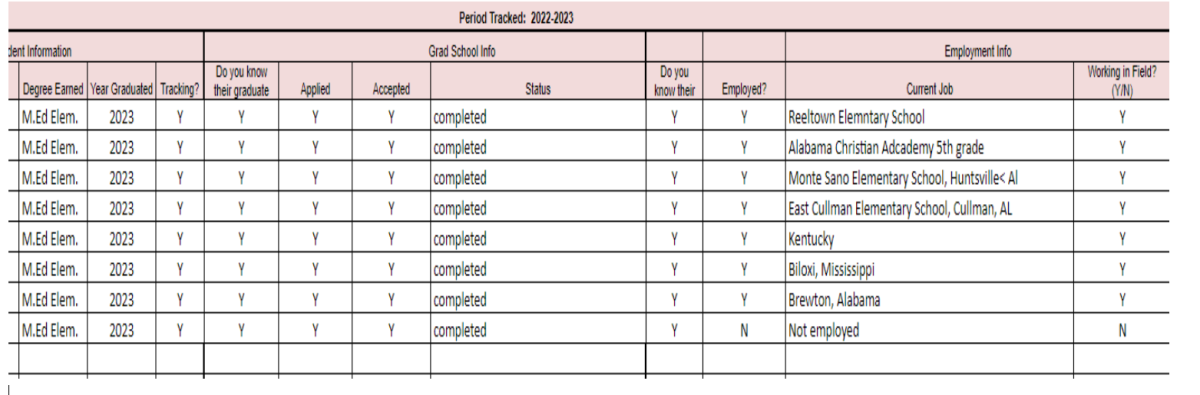
The above chart shows that 87.5% of our Alt-A Graduate candidates are employed in the areas for which they prepared (Elementary Education). One candidate has a small child and has decided to stay home with her infant for a while.
Percentage of 2022-2023 completers working in the field:
|
EPP Program Concentration |
Fall 2022 |
Spring 2023 |
Percentage of Completers working in the field |
|
Elementary Education |
3 |
10 |
84.6% |
|
Physical Education |
3 |
2 |
80% |
|
ALT-A Elementary Education |
4 |
4 |
87.5% |
|
Totals |
10 |
16 |
|
2022-2023 Data (archived)
Measure 1 (Initial): Completer Effectiveness. (R4.1)
Data from three sources will be triangulated. The first and second sources are parts of Case Studies completed by the EPP. These case studies involve several assessments, but component 1, evidence of impact, and component 3, principal interviews, will be used to meet Standard R4.1
Components of Case Studies:
- Evidence of Impact on Student Learning
- Graduate Interviews
- Principal Interviews
- Evaluations completed by a Principal or designee
The third source of data are responses to the First- and Second-Year Teacher Survey created by the Alabama Association of Colleges of Teacher Education, administered by the Alabama State Department of Education in September 2023.
Evidence of Impact on Student Learning
Evidence of impact on student learning supplied by two completers as part of case studies was used to determine if the completers effectively contributed to P-12 student-learning growth.
The spring 2022 undergraduate elementary program graduated 5 teachers. All 5 had accepted employment in the field for the 2022-2023 academic school year. Out of this pool of 5, 2 (4%) responded to the invitation to participate in the study. There were no Physical Education graduates.
The spring 2022 Alt A program graduated 3 teachers. All 3 had either accepted jobs or were already employed in the classroom. Out of this pool of 3, 1 (33%) responded to the invitation to participate in the study. This completer’s data is combined in the following information.
The participants were contacted by email and given a description of the expectations for the study along with a link to a video that also explained the expectations.
All three completers are white females.
Introduction and Background of Participants
Completer A (Elementary Education) teaches in a public school that serves 713 students PK-6. Test scores at this school are above the state average. The school population is composed of 69% white, 8% black, and 18% Hispanic students, with 59% considered low-income. Students are 56% male and 44% female.
Completer B (Elementary Education) teaches in the public school that serves 864 students, K-8. Test scores at this school are above the state average. The school population is composed of 83% white, 7% Hispanic, and 5% black, with 59% considered to be low-income. Students are 47% male and 53% female.
Completer C (Alternative A) teaches in a public school that serves 1,016 students in grades 5-8. This school ranks in the top 50% of all schools in Alabama for overall test scores (math proficiency is top 50% and reading proficiency is top 50%). The school population is 58% white, 33% black, and 4% Hispanic. Students are 55% male and 45% female.
Data for Impact on Student Learning
Completer A provided two months of progress monitoring data (August and September) for aimsweb Plus Oral Reading Fluency.
In a class of 18 first grade students, one student was absent for the second testing, 3 students did not make gains, and 14 students made gains.
- The average gain was 12 points and the range was 1 to 22.
- The average loss was 10 points and the range was 4 to 18.
Completer B provided Star language arts data for two data points for 22 second grade students: August 21, 2023 to September 7, 2023 and October 16, 2023 to October 28. 2023.
- For Aug/Sept, 36% tested at Level 5 (At/Above), 23% tested at Level 4 (At/Above), 18% tested at Level 3 (At/Above), 9% tested at Level 2 (Below) and 14% tested at Level 1 (Below). Combined, 77% test At/Above and 23% tested Below level.
- For the October testing: 41% tested at Level 5 (At/Above), 23% tested at Level 4 (At/Above, 23% tested at Level 3 (At/Above), 5% tested at Level 2 (Below) and 9% tested at Level 1 (Below). Combined, 87% tested at/above and 14% tested below level.
- When the two test dates are compared, the At/Above group increased by 10% and the Below group decreased 9%.
Completer C provided Star Reading (English) scores for two data points, Aug/Sept and Dec/Jan.
- For Aug/Sept, 17% tested at Level 5 (At/Above), 25% tested at Level 4 (At/Above), 17% tested at Level 3 (At/Above), 21% tested at Level 2 (Below), and 21% tested at Level 1 (Below). Combined, 58% tested At/Above and 42% tested Below level.
- For the October testing: 25% tested at Level 5 (At/Above), 21% tested at Level 4 (At/Above), 17% tested at Level 3 (At/Above), 21$ tested at Level 2 (Below), and 17% tested at Level 1 (Below). Combine, 63% tested At/Above and 37% tested Below.
- When the two test dates are compared, the At/Above group increased by 5% and the Below decreased by 5%.
Data from Principal Interviews
Responses from the questions for InTASC Standards 4 and 5 from the Principal Interviews were used to meet the second part of Standard 4.1, specifically, Apply in P-12 classrooms the professional knowledge, skills, and dispositions that the preparation experiences were designed to achieve.
Standards 4 and 5 are represented in Questions 8, 9, and 20-24:
Based on your observation or knowledge, how effective if the first-year teacher when it comes to:
- Demonstrating effective and accurate content knowledge?
- Appling content knowledge accurately and effectively during classroom instruction?
- Engaging in leadership, initiating and engaging in professional growth?
- Collaborating with colleagues?
- Practicing professional ethics?
- Engaging with parents and his/her community?
- Using technology effectively?
Completer A
- She is absolutely on track as a first-year teacher. She came to use with a broad knowledge base.
- She is very knowledgeable of the Science of Reading. Few other first year teachers have this strong of knowledge about it.
- Yes, she engaged in leadership, initiating and engaging in professional growth
- Yes, she collaborates with others.
- She practices professional ethics
- She engages with parents and community members
Completer B
- She definitely has the content knowledge and she understands the connections.
- She is a grade level lead planner.
- She is a professional and has ideas and knows what to do next.
- She works effectively with everyone, including parents.
Completer C
- She teaches English Language Arts and Social Studies so he has lots of ways to do cross-curricular activities.
- She has always known her content!
- She knows her 5th graders and gives them the lessons they need.
- She is aware of how each one learns and she uses a lot of small groups so that she can differentiate instruction.
- When we meet to discuss checkpoints on assessments like the STAR test, she comes with an action plan for her students based on data.
- After observations she talks of reflecting on teaching and then making changes.
Based on the responses from the three principals, the EPP has determined that completers of the Faulkner College of Education do contribute to P-12 student learning growth.
Link to Principal Interview, Initial Preparation
Data from the State’s First- and Second-Year Teacher Survey
The Educator Prep Institutional Report Cards provide data on individuals who completed a Class B or Alternative Class A program at an Alabama institution and their professional certificate was issued in the reporting period. The 2023 report covers those who passed their assessment between August 1, 2021 and July 31, 2022 along with surveys from teachers and employers between August 2022 and July 2023. The data provided is for Faulkner completers, but the data is not disaggregated for the different pursuits.
The Alabama Association of Colleges for Teacher Education members developed the surveys which are administered electronically to first- and second-year teachers and employers. Survey prompts are aligned with InTASC standards. Responses from Principals for prompts aligned with Standards 4 and 5 are represented in the following chart.
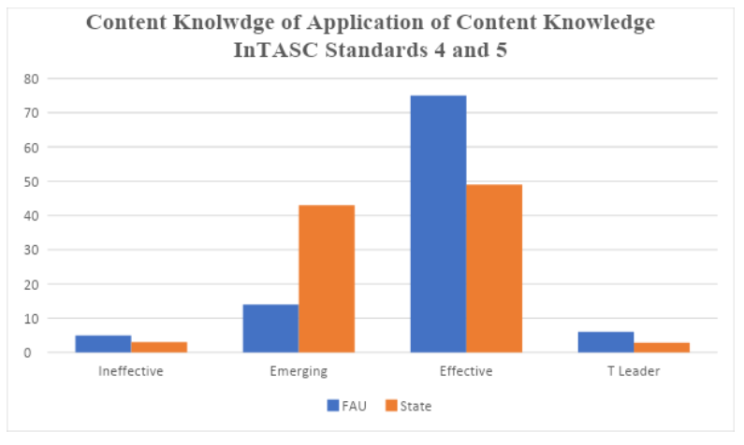
When the Faulkner graduates were compared to graduates from other Alabama EPPs, the hiring principals agreed that our graduates have a deep knowledge of content and can effectively apply their knowledge in the classroom.
Data suggests that the percentage of the EPP’s graduates considered to be Teacher Leaders exceeds that for the state average.
Link to the summary of findings from the State Report for 2023
Conclusion
Data from three sources was triangulated in order to assess Standard R4.1, the Education Preparation Providers (EPPs) supply evidence of completers contribution to P-12 student learning growth and application in P-12 classrooms the professional knowledge, skills, and dispositions that the preparation experiences were designed to achieve.
The three forms of data were 1) impact on student learning, 2) portions of principal interviews and 3) a state survey administered to first- and second-year completers. Data for impact on student learning was derived from two elementary education completers and one Alternative A completer. There were no Physical Education completers who either graduated 6 months to a year earlier, or who are teaching in field. The data supplied for the 3 completers all supports student learning.
Principal interviews were conducted with the three completers and all three positively responded that the completers did contribute to student learning.
The third source was the state survey completed by employers of completers. While this data is not disaggregated, it does reflect the entirety of completers. The comparison of survey data specific for Faulkner completers to completers state-wide found that the employers believed that our graduates have a deep knowledge of content and can effectively apply their knowledge in the classroom. Again, the data for the Effective and Teacher Learner levels exceeds that of the state average.
The convergence of findings from these sources of data, through triangulation, supports the conclusion that the completers of the Faulkner College of Education do contribute to P-12 student learning growth and apply in P-12 classroom the professional knowledge, skills, and dispositions that the preparation experiences were designed to achieve.
Measure 2 (Initial and Advanced): Satisfaction of employers and stakeholder involvement. (R4.2, R5.3, RA4.1)
Satisfaction of Employers: Initial
To assess satisfaction of employers, data from two sources was triangulated. The first source is one part of the Case Studies completed by the EPP. These case studies involve several assessments but the Principal Interviews directly assesses the satisfaction of principals with specific completers.
Two principal interviews were conducted with principals of two completers from the Elementary Education program and one completer from the Alternative A program. All three are white females. These volunteers are from a group of 5 elementary completers and three Alternative A completers, representing 4% and 33% respectfully. There were no Physical Education completers.
The second source is data from Principals’ responses to the First- and Second-Year Teacher Survey created by the Alabama Association of Colleges of Teacher Education and administered by the Alabama State Department of Education in September 2023.
Introduction and Background of Participants
Completer A (Elementary Education) teaches in a public school that serves 713 students PK-6. This school’s test scores are above the state average. The school population is composed of 69% white, 8% black, and 18% Hispanic students, with 59% considered low-income. Students are 56% male and 44% female.
Completer B (Elementary Education) teaches in a public school that serves 864 students, K-8. This school’s test scores are above the state average. The school population is composed of 83% white, 7% Hispanic, and 5% black, with 59% considered to be low-income. Students are 47% male and 53% female.
Completer C (Alternative A) teaches in a public school that serves 1,016 students in grades 5-8. This school ranks in the top 50% of all schools in Alabama for overall test scores (math proficiency in top 50% and reading proficiency in top 50%). The school population is 58% white, 33% black, and 4% Hispanic. Students are 55% male and 45% female.
Data to Support Employer Satisfaction with Preparation in Working with Diverse Students and Families
Principal Interviews
Responses from the questions for InTASC standards 2, 3, and 10 from the Principal Interviews were used to assess this standard. Specific questions for these standards are:
Based on your observation or knowledge, how effective if the first-year teacher when it comes to:
- Effectively differentiating instruction and meeting the needs of individual students?
- Working in inclusive classrooms?
- Effectively teaching students from diverse backgrounds?
- Engaging with parents and his/her community?
Completer A
- She is very effective. She has special ed and ELL students in her class. She adjusts her instruction to meet the needs of all her students.
- Yes, she absolutely practices professional ethics.
- She does very well with parents. She reaches out with both praise and not just when there are problems. She is very proactive.
Completer B
- Yes, she effectively differentiates instruction and meets the needs of her individual students.
- She just knows what to do for each student, and she does it.
- She is more than prepared to effectively teach students from diverse backgrounds.
- She works effectively with everyone, including parents.
Completer C
- She knows her 5th graders and gives them the lessons they need. She is aware of how each one learns and she uses a lot of small groups so that she can differentiate instruction.
- She is excellent with parents. At the beginning of school, we call all students in the homerooms. I sat in on one parent conference with her and a students’ great-grandmother. It was a good meeting and Mrs. Xxxx has a great rapport with the grandmother.
Link to Principal Interview, Initial Preparation
Data from the State’s First- and Second-Year Teacher Survey
The Educator Prep Institutional Report Cards provide data on individuals who completed a Class B or Alternative Class A program at an Alabama institution and their professional certificate was issued in the reporting period. The 2023 report covers those who passed their assessment between August 1, 2021 and July 31, 2022 along with surveys from teachers and employers between August 2022 and July 2023. The data provided is for Faulkner completers, but the data is not disaggregated for the different pursuits.
The Alabama Association of Colleges for Teacher Education members developed the surveys which are administered electronically to first- and second-year teachers and employers. Survey prompts are aligned with InTASC standards. Responses from Principals for prompts aligned with Standards 2 and 3 are represented in the following chart. Responses for Standard 10 are in the second chart.
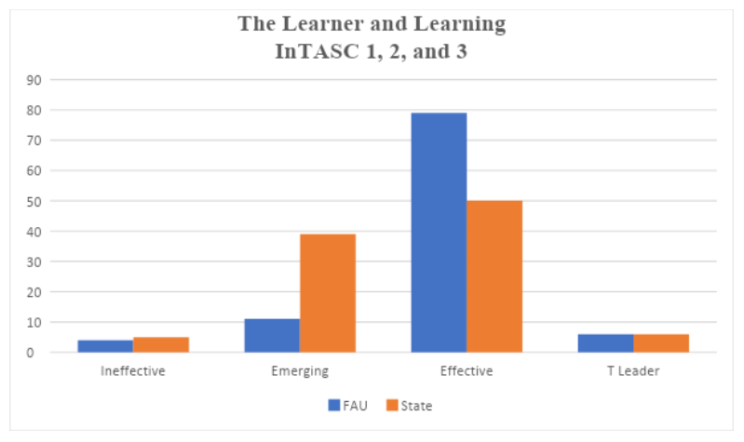
When the Faulkner graduates were compared to graduates from other Alabama EPPs, the hiring principals agreed that our graduates are more effective in understanding how learners grow and develop, more effective in understanding learners’ commonalities and individual differences, and better understand how to manage the learning environment to engage learners actively.
Data suggests that the percentage of the EPP’s graduates considered to be Teacher Leaders is equal to that for the state average.
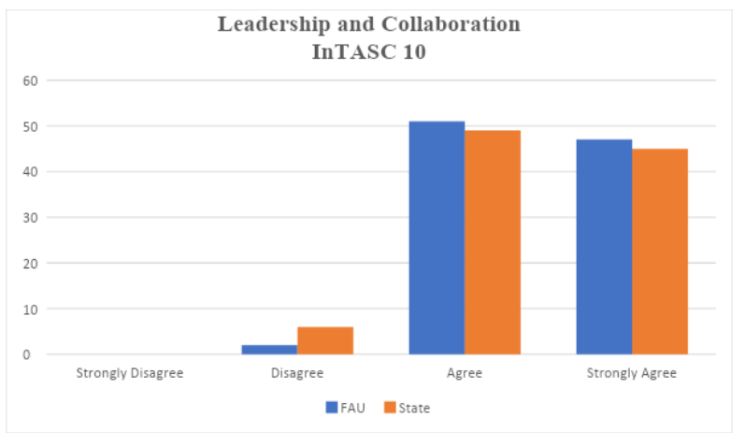
When the Faulkner graduates were compared to graduates from other Alabama EPPs, the hiring principals agreed that our graduates are more effective in collaborating with learners, families, colleagues, and other school professions and community members and that they more often seek appropriate leadership roles.
Data suggests that the percentage of the EPP’s graduates considered to be Teacher Leaders is greater than the state average.
Link to the summary of findings from the State Report for 2023
Conclusion, Initial
Data from two sources was triangulated in order to assess Standard R4.2, The provider demonstrates employers are satisfied with the completer’s preparation for their assigned responsibilities in working with diverse P-12 students and their families.
The two forms of data were principal interviews and a state survey administered to employers of first- and second-year completers. Data was derived from two elementary education completers and one Alternative A completer. There were no Physical Education completers who either graduated 6 months to a year earlier, or who were teaching in field.
Principal interviews were conducted with the three completers and all three positively responded that their preparation was satisfactory.
The second source was the state survey completed by employers of completers. While this data is not disaggregated, it does reflect the entirety of completers. The comparison of survey data specific for Faulkner completers to completers state wide found that the employers believed that the EPP’s completers were effective in understanding the commonalities and differences of students and effective in collaborating with learners, families, colleagues, and other school professions and community members. When the number of Faulkner completers rated effective and teacher leader were compared to the total number of completers included in the survey, Faulkner completers equaled or exceeded numbers for completers from other institutions.
Based on the convergence of findings from these two sources of data, through triangulation, supports the conclusion that the employers of completers of the Faulkner College of Education are satisfied with the completers’ preparation for their assigned responsibilities in working with diverse P-12 students and their families.
Satisfaction of Employers, Advanced
There were five completers during 2022-2023. One completer (20%) volunteered and one participated. This completer is a teacher at a small urban public school, Pre-K through 6th grade. The completer teaches science and social studies. The school serves 568 students and has a minority enrollment of 12%. The student-teacher ratio is 18:1. The student population is made up of 52% females and 48% males. The school enrolls 33% economically disadvantages students. The school has been selected as a CLAS Alabama School of Distinction.
Data from two sources was triangulated. The first source is one part of the Case Studies completed by the EPP. These case studies involve several assessments but the Principal Interviews directly assesses the satisfaction of principals with specific completers.
The second source of data came from an Advanced Employer survey.
Principal Interview
The Principal Interview includes 9 prompts aligned with the National Board Middle Childhood Standards. Link to interview questions.
Based on your observation or knowledge, how effective if the first-year teacher when it comes to:
The following responses are grouped by topic:
Strengths Noted:
- Calm demeanor
- Treats all students equally
- Strong science content knowledge
- Analyzes data and uses that information for future planning
- Very professional
- Have a good professional relationship with peers and parents
- Handles change well
- Eager to improve her craft
Areas for Improvement Noted:
- Sometimes her expectations for students’ science knowledge is set too high
- Adjusting to parents in a rural area after coming from an urban area
And, when asked for any additional comments, the principal stated that the teacher is a little above normal for a beginning teacher. She is mature and organized.
Advanced Employers Survey
The third source is data from the Advanced Employer Survey. This EPP designed survey includes prompts that reflect the National Board Middle Childhood Specialists standards. The survey includes multiple prompts per standards.
Principals are given a QR code to complete the Google survey. The results for this completer by National Board Standards are as follows:
Standard I: Knowledge of Students: 2/2 Strongly Agree
Standard II: Respect for Diversity: 2/3 Strongly Agree, 1/3 Agree
Standard III: Establishing an Environment for Learning: 1/2 Strongly Agree, 1/2 Agree
Standard IV: Knowledge of Content and Curriculum: 3/3 Strongly Agree
Standard V: Instructional Decision Making: 5/6 Strongly Agree, 1/6 Agree
Standard VI: Partnership and Outreach: 2/2 Agree
Standard VII: Professionalism, Leadership, and Advocacy: 1/3 Strongly Agree, 2/3 Agree
Standard VIII: Responsiveness to Change: 1/1 Agree
16 of 27 responses, or 59%, were Strongly Agree, and 11 of 27 responses, or 41% were Agree. When asked to respond to prompt concerning suggestions for improvements for the Faulkner College of Education advanced preparation program, there was no response.
When asked to respond concerning strengths of the program, there was no response.
Link to the Google survey responses:
Note: There were multiple responders, but there was only one completer who had all elements completed.
Conclusion, Advanced
The two forms of data were principal interviews and an employers survey.
A principal interview was conducted with one of five completers. The principal positively responded that preparation was satisfactory.
A principal survey was the second form of data. Again, the principal positively responded that preparation was satisfactory.
Based on the convergence of findings from these two sources of data, through triangulation, supports the conclusion that the employers of completers of the Faulkner College of Education are satisfied with the completers’ preparation for their assigned responsibilities in working with diverse P-12 students and their families.
Stakeholder Involvement
Faulkner COE Teacher Advisory Council (TAC)
The Teacher Advisory Council for the College of Education at Faulkner University includes a variety of individuals who hold a variety of roles within the University, Partner Schools, Partner School Systems, and outside education agencies. Many are professors, program completers, classroom teachers, principals, Central Office Staff, Heads of Schools, and past/retired school officials.
The council is devised to allow outside stakeholders to join the COE in making programs more effective. The council meets twice a year to review data and look at program improvements.
Link to Council/Committee Members
April 26, 2022
May 8, 2023
The minutes include information about what assessments were reviewed and evaluated along with recommendations by the committee members.
Attendees:
Dr. Nicki McLeod Faulkner Professor
Dr. Brian Lentz Faulkner, Former Community College
Dr. Elizabeth Davis Faulkner, Former ALSDE
Dr. Carol Tarpley Faulkner
Rebecca Horn Faulkner
Dr. Christi Jones Faulkner
Taryn Brodie Second Grade Teacher
Brittney Fureigh State Department, 3-5 Science Specialist
Bryant Marlow Principal
Brittney Kelly School Counselor
Lisa Boyd School Counselor
Michelle Williamson School Counselor
Hilary Rasmussen Completer, Teacher Reeltown Elementary
Laura Childs Completer, ARI Literacy Specialist
Mark McGee Alabama Department of Education
Bonnie Short Director, Alabama Reading Initiative
MOUs/Partnerships
The College of Education at Faulkner University is proud to have a variety of partnerships with school systems and individual schools in which our teacher candidates have an opportunity to work side by side with certified teachers to enrich their experiences in the classroom. The COE utilizes these schools for a variety of field experiences as well as internships. Through our partnerships, the COE strives to ensure our candidates are seeing a wide variety of teaching strategies, good classroom management, and professionalism.
The Faulkner University College of Education maintains MOUs with the following Schools and School Districts:
- Autauga County
- Cullman City
- Elmore County
- Lead Academy
- Chilton County
- Dale County
- Macon East
- Shelby County
- Alabama Christian Academy
- Prattville Christian Academy
- Churchill Academy
- Flowers Elementary
- Crump Elementary
- Pike Road Elementary
- Vaughn Road Elementary
- Blount Elementary
- Wilson Elementary
- Pike County
- Mobile Christian Elementary
- Bear Exploration Center
- Halcyon Elementary
Measure 3 (Initial and Advanced): Candidate competency at completion. (R3.3)
The ability of completers to meet licensing requirements, including certification and any additional state-specific mandates, is crucial for the candidates’ career prospects in education.
Initial
For Measure 3, data from the following sources was triangulated.
- Meeting the EPPs Requirements: Initial and Advanced
- Internship Averages: Initial
- Elementary Praxis/Foundations of Reading Scores: Initial
Meeting the EPPs Requirements
The College of Education’s Handbook outlines the following requirements for completion of degrees:
Undergraduate Class B Elementary Education and Physical Education Candidates
To remain in the Teacher Education Program, a candidate must continuously meet the following requirements:
- Maintain a minimum of 2.75 grade point average overall, in professional studies and in the teaching field.
- Demonstrate professional dispositions during all coursework and clinical experiences.
- Submit all coursework demonstrating successful completion of ACTS and SPA standards mastery.
- Completion of all program gateways according to the mandated timeframes.
- Completion with passing scores of all state-required assessments (Praxis Exams, Foundations of Reading 190, and edTPA.
Any grade below a "C" in Professional Studies courses will not be used to meet certification requirements. ALSDE (Alabama State Department of Education) policies and university policies must be followed in the calculation of GPA and awarding of credit for courses taken and courses repeated. ALSDE policies will supersede university policies.
Alternative Master’s (ALT-A) Candidates
- All candidates entering the ALT-A in Elementary Education must meet the 4x12 in English Language Arts (4 English courses granting 12 hours of credit).
2.. To remain in the program, each candidate must maintain a 3.25 GPA in all areas.
- At the appropriate time, all candidates take the Praxis Exam(s) required by the state for licensure and Elementary Education candidates also take the Foundations of Reading Assessment. All Praxis exams and the Foundations of Reading must meet the minimum score before moving on to the internship. During the last semester of all initial certification programs, candidates must do a full-semester internship and maintain average and above ratings from mentor teachers and university supervisors.
Internship Averages
Below are the internship averages as determined by the mentor teacher and university supervisors. Candidates are assessed with the Teacher Candidate Assessment 8 times throughout the internship semester, with the mentor teacher and university supervisor each doing 4 formal observations. The rankings are:
Rating Scale:
- Ineffective
- Developing
- Effective
- Distinguished
- Exemplary
Internship Unit Averages Fall 2022
Undergrads
|
Candidate |
PL. 1 |
PL. 2 |
Final Avg. |
|
Elementary Education |
|||
|
Candidate 1 WF |
4 |
4.72 |
4.36 |
|
Candidate 2 WF |
4.3 |
3.9 |
4.1 |
|
Candidate 3 WF |
3.78 |
4.0 |
3.97 |
|
Final Cohort Avg. |
4.02 |
4.24 |
4.13 |
|
Physical Education |
PL.1 |
PL.2 |
Final Avg. |
|
|
|
|
|
|
Candidate 1 WF |
4.45 |
4.5 |
4.47 |
|
Candidate 2 BM |
4.71 |
4.4 |
4.5 |
|
Candidate 3 WM |
4.91 |
4.46 |
4.68 |
|
|
|
|
|
|
Final Cohort Avg. |
4.69 |
4.45 |
4.55 |
Internship Unit Averages Spring 2023
Undergrads
|
Student |
Pl. 1 |
Pl. 2 |
Final Avg. |
|
Elementary |
|
|
|
|
Candidate 1 WF |
3.34 |
4.16 |
3.75 |
|
Candidate 2 WF |
3.86 |
4.37 |
4.1 |
|
Candidate 4 BF |
3.7 |
4.12 |
3.91 |
|
Candidate 5 WF |
5 |
4.97 |
4.9 |
|
Candidate 6 WF |
4.28 |
4.72 |
4.5 |
|
Candidate 7 WF |
4.36 |
4.97 |
4.66 |
|
Candidate 8 WF |
4.54 |
4 |
4.25 |
|
Candidate 9 WF |
4.01 |
4.25 |
4.13 |
|
Candidate 10 WF |
4.94 |
4.85 |
4.9 |
|
Candidate 11 WF |
4.18 |
3.85 |
4.01 |
|
|
|
|
|
|
Final Cohort Average: |
4.26 |
4.43 |
4.34 |
|
|
|
|
|
|
Physical Education |
|
|
|
|
Candidate 1 BM |
4.5 |
4.51 |
4.5 |
|
Candidate 2 WM |
4.39 |
4.59 |
4.49 |
|
|
|
|
|
|
Final Cohort Avg. |
4.45 |
4.55 |
4.49 |
Praxis Scores
Fall 2022-Spring 2023 Elementary Praxis/Foundations of Reading Scores
Undergraduate Candidates INTERNSHIP COHORT
Praxis Exams are a series of American teacher certification exams written and administered by the Educational Testing Service. Various Praxis tests are usually required during educator preparation programs to measure candidate abilities.
The Foundations of Reading test (test code 190) for Alabama assesses proficiency in and depth of understanding of the subject of reading and writing development. The test reflects scientifically based reading research.
The data below consists of candidates’ scores before Internship entry. During this academic year, the following candidates met the national testing requirements to enter their Internship semester.
Below are the passing score in parentheses under each named assessment. For a short time, the State Department of Education allowed students to pass with a -1 Standard Error of Measurement (SEM) due to the national teacher shortage and the need to get teachers into classrooms. Scores with an * were a little under the previously required score. This is no longer in effect and the passing scores are back to the scores indicated in the parentheses under each category. As you can see, Faulkner University College of Education candidates surpassed the passing score in every subject area even though a few candidates qualified under the temporary -1 Standard Error of Measurement score.
|
Candidate |
Foundations of Reading Score (233) |
Tchg. Rdg #5205 (159) |
Math # 5903 (157) |
Social Studies #5904 (154) |
Science #5905 (158) |
|
Candidate 1 WF |
X |
164 |
184 |
154 |
159 |
|
Candidate 2 WF |
X |
159 |
160 |
151 |
159 |
|
Candidate 3 WF |
X |
163 |
190 |
161 |
180 |
|
Candidate 4 WF |
249 |
X |
161 |
172 |
163 |
|
Candidate 5 WF |
241 |
X |
151** |
168 |
158 |
|
Candidate 6 BF |
241 |
X |
157 |
155 |
172 |
|
Candidate 7 WF |
239 |
X |
187 |
160 |
158 |
|
Candidate 8 WF |
X |
160 |
160 |
148** |
159 |
|
Candidate 9 WF |
X |
166 |
167 |
147** |
175 |
|
Candidate 10 WF |
X |
166 |
159 |
159 |
170 |
|
Candidate 11 WF |
X |
169 |
175 |
165 |
178 |
|
Candidate 12 WF |
X |
167 |
179 |
162 |
158 |
|
Avg. WF: |
243 |
164.2 |
170.2 |
158.8 |
165.18 |
|
Avg. BF: |
241 |
N/A |
157 |
155 |
172 |
|
Total Avg.: |
242.5 |
164.2 |
169.1 |
158.5 |
165.75 |
**Took the -1 SEM
Fall 2022 Spring 2023- INTERNSHIP COHORT
Alt. A Candidates – Praxis Scores for Math, Social Studies, and Science were met before Teacher Education Program (TEP) entry.
Reading Praxis/Foundations of Reading were met prior to their internship.
|
Candidate |
FOR Score (233) |
Tchg. Rdg #5205 (159) |
Math # 5903 (157) |
Social Studies #5904 (154) |
Science #5905 (158) |
|
Candidate 1 WF |
261 |
X |
164 |
166 |
172 |
|
Candidate 2 WF |
275 |
X |
190 |
171 |
169 |
|
Candidate 3 WF |
263 |
X |
160 |
184 |
171 |
|
AVG: WF |
266 |
N/A |
171 |
173 |
170.6 |
Fall 2022-Spring 2023 Physical Education Praxis required prior to internship semester
|
Candidate |
Physical Education Praxis #5091 (149) |
|
|
Candidate 1 WF |
151 |
|
|
Candidate 2 BM |
151 |
|
|
Candidate 3 WM |
164 |
|
|
Candidate 4: WM |
151 |
|
|
Candidate 5: BM |
148** |
|
|
Avg: BM |
149.5 |
|
|
Avg. WM |
157.5 |
|
|
Avg. WF |
151 |
|
|
Total Avg. |
153 |
** Took the -1 SEM
Advanced
Class A Traditional Master’s
The EPP considers candiates to be competent at completion of their program when they have met the following requirements as set forth in the Graduate Handbook:
- Candidacy and admission into the Teacher Education Program.
- Completion of all courses and requirements listed on the appropriate degree plan, including 30 semester hours of graduate credit not used for any prior-level certification or degree in any teaching field or area of instructional support.
- Completion of a minimum total hours of clinical experiences.
- Completion of all institutional requirements for graduation, i.e., filing of appropriate forms with the Registrar’s Office, exit interview with the Financial Aid Office, and clearance with the Business Office.
- Minimum GPA of 3.25
- Successful completion of the master level special education course—if a special education course was completed prior to unconditional admission to the Traditional Class A Elementary program, students must take FED 6345, Multicultural Education. A course used to meet the requirement for one level of certification may not be used to meet the requirement for a higher level of certification.
- Satisfactory ratings on disposition forms from professors for each education course taken.
- Successful completion of the Capstone Portfolio
- A valid Class B Professional Educator Certificate in the same teaching field in which the Class A Professional Educator Certificate is sought.
Measure 4 (Initial and Advanced): Ability of completers to be hired in positions for which they have prepared).
Initial Certification Tracking – Graduates in Fall 2022 and Spring 2023
The linked chart shows that 96% of our candidates who graduated in 2022-2023 are working in the field full-time in the area in which they prepared.
Advanced Certification Tracking - Graduates in Fall 2022 and Spring 2023
The linked chart shows that 100% of our candidates are employed in the areas for which they prepared.
Accreditation
Initial Certification Programs
B.S. in Elementary Education
B.S. in Physical Education
B.A. in English Language Arts Secondary Education
Bachelor of Music Education (BME) - Choral Track
Bachelor of Music Education (BME) - Instrumental Track
B.S. in Social Science Secondary Education
M.Ed. in Secondary Education - Social Science Alternative A
M.Ed. in Secondary Education - English Language Arts Alternative A
M.Ed. in Elementary Education Alternative
Advanced Certification Programs